Tyson Foods Reports First Quarter 2025 Result
Delivers Year-Over-Year Top and Bottom-Line Growth; Raises Fiscal Year 2025 Guidance

Tyson Foods, Inc. (NYSE: TSN), one of the world’s largest food companies and a recognized leader in protein with leading brands including Tyson, Jimmy Dean, Hillshire Farm, Ball Park, Wright, Aidells, ibp and State Fair, reported the following results.


First Quarter Highlights
- Sales of $13,623 million, up 2.3% from prior year
- GAAP operating income of $580 million, up 151% from prior year
- Adjusted operating income of $659 million, up 60% from prior year
- GAAP EPS of $1.01, up 237% from prior year
- Adjusted EPS of $1.14, up 65% from prior year
- Total Company GAAP operating margin of 4.3%
- Total Company adjusted operating margin (non-GAAP) of 4.8%
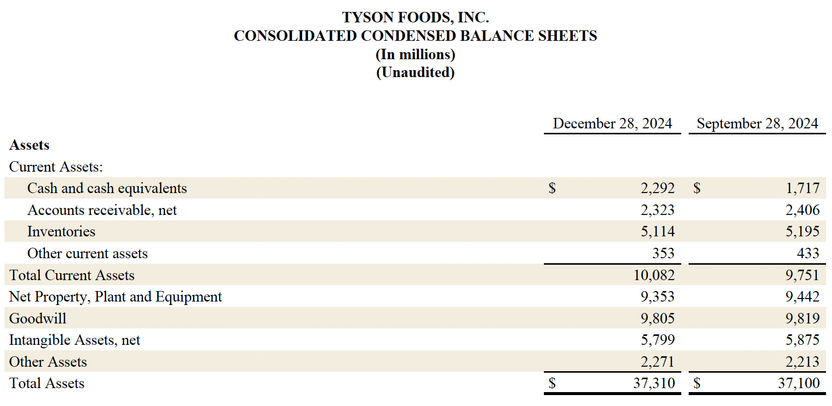
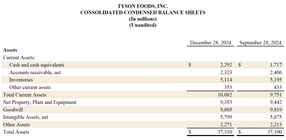
- Liquidity of $4.5 billion as of December 28, 2024
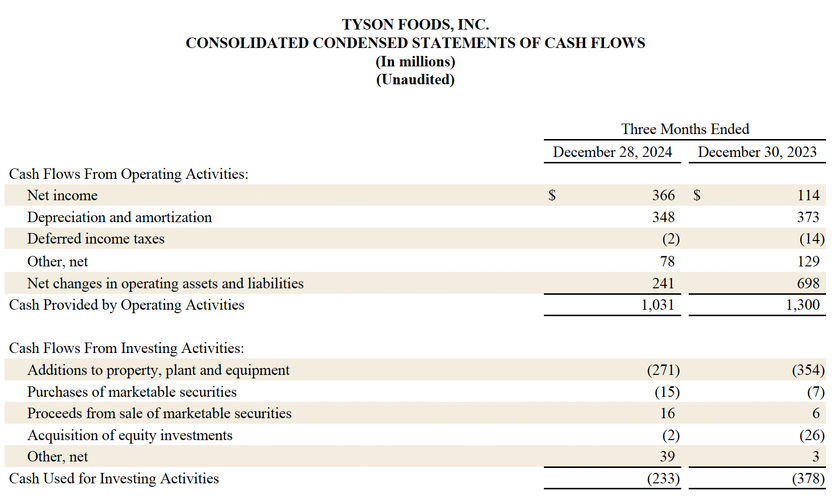
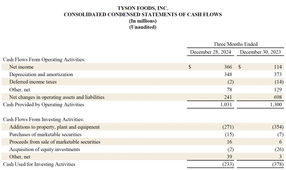
- Cash provided by operating activities of $1,031 million, down $269 million from prior year
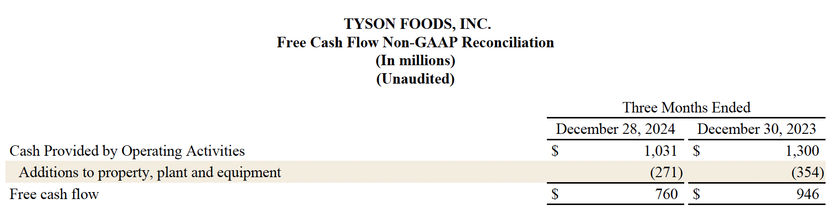
- Free cash flow (non-GAAP) of $760 million, down $186 million from prior year
"Fiscal year 2025 is off to a strong start, as we delivered our third consecutive quarter of year-over-year growth in sales, operating income, and EPS," said Donnie King, President & CEO of Tyson Foods. "Our best quarterly performance in more than two years reflects improved execution across the business, including exceptional results in chicken. Consumers remain focused on adding protein to their diets, and our diversified multi-channel, multi-protein portfolio ensures we are well-positioned to meet this demand while reinforcing our leadership as a world-class food company."
OUTLOOK
For fiscal 2025, the United States Department of Agriculture (USDA) indicates domestic protein production (beef, pork, chicken and turkey) will increase approximately 1% compared to fiscal 2024 levels. The following is a summary of the updated outlook for each of our segments, as well as an outlook for revenue, capital expenditures, net interest expense, liquidity, free cash flow and tax rate for fiscal 2025. Certain of the outlook numbers include adjusted operating income (loss) (a non-GAAP metric) for each segment. The Company is not able to reconcile its full-year fiscal 2025 projected adjusted results to its fiscal 2025 projected GAAP results because certain information necessary to calculate such measures on a GAAP basis is unavailable or dependent on the timing of future events outside of our control. Therefore, because of the uncertainty and variability of the nature of and the amount of any potential applicable future adjustments, which could be significant, the Company is unable to provide a reconciliation for these forward-looking non-GAAP measures without unreasonable effort. Adjusted operating income (loss) should not be considered a substitute for operating income (loss) or any other measures of financial performance reported in accordance with GAAP. Investors should rely primarily on the Company’s GAAP results and use non-GAAP financial measures only supplementally in making investment decisions.
Beef
USDA projects domestic production will decrease approximately 1% in fiscal 2025 as compared to fiscal 2024. We anticipate adjusted operating loss between $(0.4) billion and $(0.2) billion in fiscal 2025.
Pork
USDA projects domestic production will increase approximately 2% in fiscal 2025 as compared to fiscal 2024. We anticipate adjusted operating income of $0.1 billion to $0.2 billion in fiscal 2025.
Chicken
USDA projects chicken production will increase approximately 2% in fiscal 2025 as compared to fiscal 2024. We anticipate adjusted operating income of $1.0 billion to $1.3 billion for fiscal 2025.
Prepared Foods
We anticipate adjusted operating income of $0.9 billion to $1.1 billion in fiscal 2025.
International/Other
We anticipate improved results from our foreign operations in fiscal 2025 on an adjusted basis.
Total Company
We anticipate total company adjusted operating income of $1.9 billion to $2.3 billion for fiscal 2025.
Revenue
We expect sales to be flat to up 1% in fiscal 2025 as compared to fiscal 2024.
Capital Expenditures
We expect capital expenditures between $1.0 billion and $1.2 billion for fiscal 2025. Capital expenditures include investments in profit improvement projects as well as projects for maintenance and repair.
Net Interest Expense
We expect net interest expense to approximate $375 million for fiscal 2025.
Liquidity
We expect total liquidity, which was $4.5 billion as of December 28, 2024, to remain above our minimum liquidity target of $1.0 billion.
Free Cash Flow
We expect free cash flow to be between $1.0 billion and $1.6 billion for fiscal 2025.
Tax Rate
We currently expect our adjusted effective tax rate to approximate 25% for fiscal 2025.
Non-GAAP Financial Measures
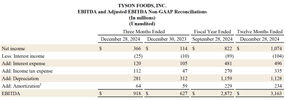
Adjusted Operating Income (Loss), Adjusted Income before Income Taxes, Adjusted Income Tax Expense, Adjusted Net Income Attributable to Tyson and Adjusted EPS, EBITDA, Adjusted EBITDA, net debt to EBITDA, net debt to Adjusted EBITDA and Free Cash Flow are presented as supplemental financial measures in the evaluation of our business that are not required by, or presented in accordance with GAAP. The non-GAAP financial measures are tools intended to assist our management and investors in comparing our performance on a consistent basis for purposes of business decision-making by removing the impact of certain items that management believes do not directly reflect our core operations on an ongoing basis. These non-GAAP measures should not be a substitute for their comparable GAAP financial measures. Investors should rely primarily on our GAAP results and use non-GAAP financial measures only supplementally in making investment decisions. We believe the presentation of these non-GAAP financial measures helps management and investors to assess our operating performance from period to period, including our ability to generate earnings sufficient to service our debt, enhances understanding of our financial performance and highlights operational trends. These measures are widely used by investors and rating agencies in the valuation, comparison, rating and investment recommendations of companies. Our calculation of non-GAAP measures may not be comparable to similarly titled measures reported by other companies and other companies may not define these non-GAAP financial measures in the same way, which may limit their usefulness of comparative measures.
Definitions
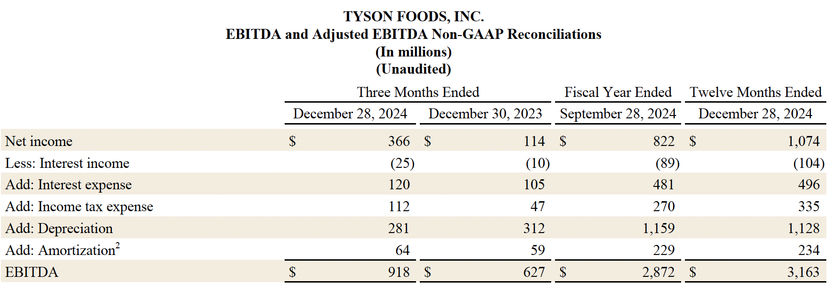
EBITDA is defined as net income (loss) before interest, income taxes (benefits), depreciation and amortization. Net debt to EBITDA (Adjusted EBITDA) represents the ratio of our debt, net of cash, cash equivalents and short-term investments, to EBITDA (and to Adjusted EBITDA). EBITDA, Adjusted EBITDA, net debt to EBITDA and net debt to Adjusted EBITDA are presented as supplemental financial measurements in the evaluation of our business.
Adjusted EBITDA, Adjusted Operating Income (Loss), Adjusted Income (Loss) before Income Taxes, Adjusted Income Tax Expense (Benefit), Adjusted Net Income (Loss) Attributable to Tyson and Adjusted EPS are defined as EBITDA, Operating Income (Loss), Income (Loss) before Income Taxes, Income Tax Expense (Benefit), Net Income (Loss) Attributable to Tyson and diluted earnings per share, respectively, excluding the impacts of any items that management believes do not directly reflect our core operations on an ongoing basis.
Free Cash Flow is defined as Cash Provided by Operating Activities minus payments for Property, Plant and Equipment.

Other news from the department business & finance